1. Overview: A System Built on Assumptions Meets Reality
The UK’s energy system is repeatedly described as being on a clear pathway toward full decarbonisation. Government claims of a “clean power system by 2030” and a “zero-carbon grid by 2035” rely on an assumption that wind, solar and batteries can collectively displace fossil fuels while maintaining stability across all seasons. Today’s real-time grid data tells a different story.The screenshots below were taken within the same hour and offer a precise, unfiltered snapshot of the British electricity system. What they reveal is not a system transitioning toward Net Zero, but one structurally dependent on gas, nuclear and interconnector imports, with solar and storage contributing almost nothing. This is not an anomaly. It is a daily winter pattern documented by National Grid ESO.
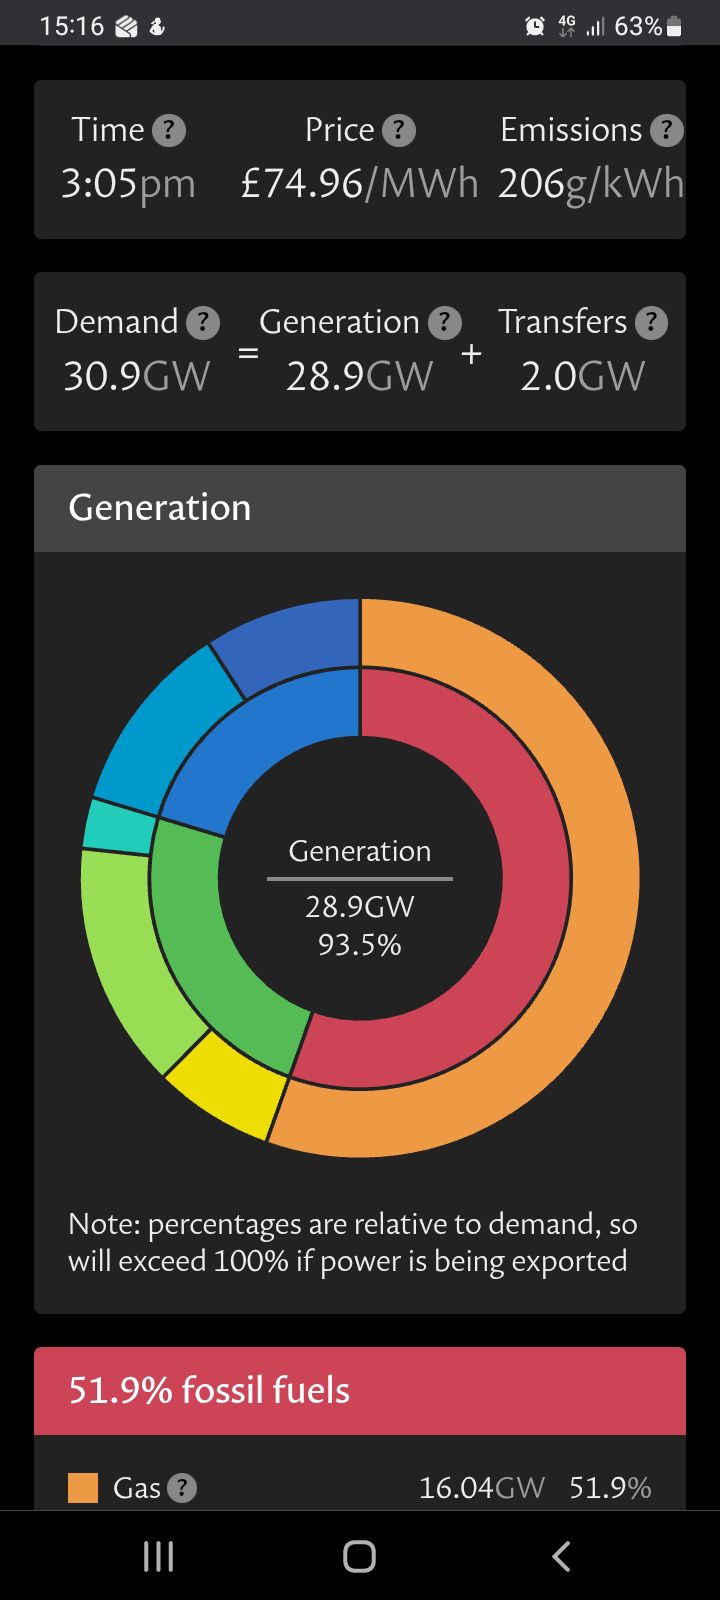
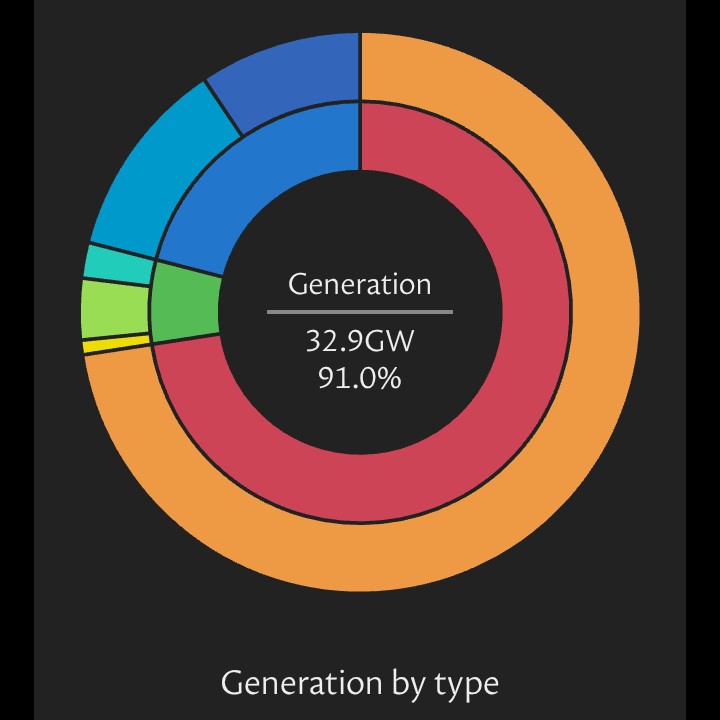
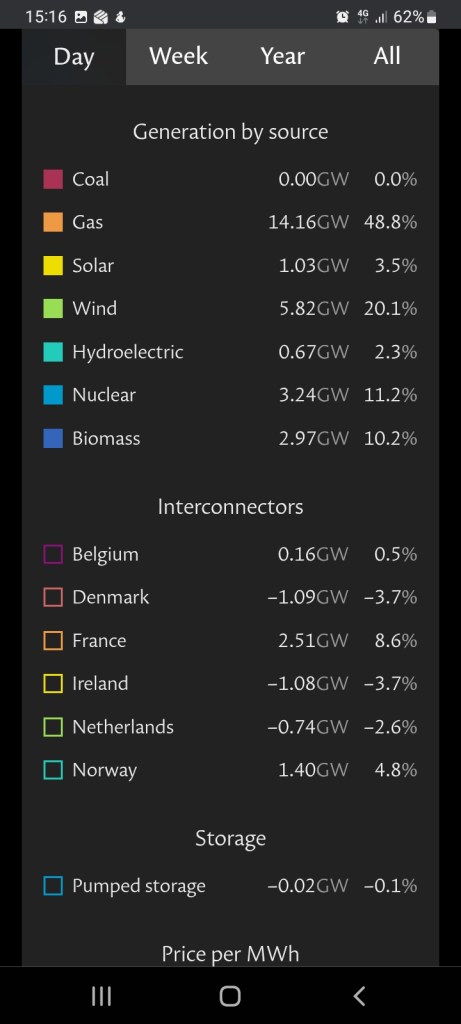
2. Gas Remains the Dominant Power SourceAcross today’s readings, gas generation ranged from 14.16 GW to 16.04 GW, equal to approximately half of all electricity produced. This is entirely consistent with National Grid ESO winter averages, where gas routinely supplies between 40 and 55 percent of total demand.Despite legal commitments under Carbon Budgets 4, 5 and 6 to reduce gas usage dramatically by 2030–2037, the system recorded no such trend. Instead, the UK remains fundamentally reliant on gas for flexible, dispatchable generation whenever renewables underperform. This dependency will only deepen as older nuclear stations retire before replacements enter the grid.

3. Solar Output Collapses at the Exact Moment the UK Needs Power Today’s solar output fell to as little as 1.03 GW, representing just 3.5 percent of total supply. Even at its peak in the middle of the day, solar reached only 2.02 GW, or 6.5 percent. Despite more than 21 GW of installed solar capacity, the system delivered only a fraction of that potential.DESNZ solar performance statistics and Met Office irradiance maps confirm that UK winter solar capacity factors routinely fall to 2-7 percent. Today’s real-time data is a textbook example. No serious winter grid can rely on a source that produces virtually nothing during peak heating demand. Yet policy continues to drive the expansion of ground-mounted solar on productive farmland across the UK.
4. Wind Output Demonstrates Its Volatility
Wind output today ranged from 4.13 GW (13.4 percent) to 5.82 GW (20.1 percent). These values are significantly below installed capacity and highlight the volatility inherent in weather-dependent power.High-pressure winter systems often produce multi-day wind droughts, a fact repeatedly acknowledged in official reports including DESNZ’s 2023 Weather Risk to Renewables assessment and the CCC’s Sixth Carbon Budget modelling. However, Net Zero delivery plans still treat wind as a near-firm capacity resource. Today’s performance demonstrates why this assumption is untenable.
5. Nuclear:
The Only Reliable Low-Carbon Generation
Nuclear output remained steady between 3.24 and 3.87 GW, representing 10–12 percent of total supply. Nuclear is the UK’s only stable low-carbon source, yet its contribution has halved over the past two decades due to plant retirements and chronic delays in new nuclear construction.Official BEIS and DESNZ data confirm that without new nuclear capacity entering service before the mid-2030s, the UK will suffer a widening reliability gap. Today’s data illustrates exactly why nuclear is indispensable in a decarbonised system and why the UK cannot meet its statutory targets without significant and accelerated nuclear investment.
6. The UK Leaned Heavily on Imports
The screenshots show substantial imports from France, Norway and Belgium throughout the day, totalling between 2.5 and 4.7 GW. These imports compensated for low renewable output. At the same time, the UK exported smaller volumes to Denmark, Ireland and the Netherlands, resulting in a net import position.Reliance on imported electricity undermines claims of “energy sovereignty” and exposes the UK to geopolitical risk, price volatility and regional weather patterns beyond national control. Interconnector dependence may work under normal conditions, but it cannot replace domestic firm generation in a prolonged continental-wide weather event or during geopolitical disruption.
7. Storage Failed Again: Zero Output When Needed Most
Battery and pumped storage recorded either zero output or negative output across all readings. Pumped storage briefly recorded –0.02 GW, indicating replenishment rather than generation. This aligns with National Grid data showing the UK has only 3–4 GWh of usable storage, enough to power the country for fewer than ten minutes.Short-duration lithium-ion storage cannot backstop renewables, cannot cover wind droughts, and cannot replace gas turbines. Today’s readings demonstrate this unequivocally. The UK’s Net Zero strategy assumes storage will scale to hundreds of gigawatts by 2035. The technology does not exist, and no plausible road map suggests it will.
8. Conclusion:
A System That Cannot Deliver Net Zero
Today’s real-time grid data exposes the central illusion of UK energy policy: that intermittent renewables and short-duration batteries can replace firm thermal and nuclear generation within a decade. Instead, the data shows a system still dominated by gas, increasingly dependent on imports and kept stable by nuclear stations that are approaching the end of their operational lives.Solar collapsed. Wind underperformed. Storage did nothing. Gas and imports carried the country. This is the operational reality of the UK electricity system and it stands in direct contradiction to the modelling and assumptions that underpin the Climate Change Act, the Carbon Budgets, and the Clean Power targets.If the UK wants real energy security, real affordability and real decarbonisation, it must rebuild its system on engineering reality rather than legal deadlines and political slogans. Today’s grid data is not a warning, it is a diagnosis.
Shane Oxer — Campaigner for fairer and affordable energy

Leave a comment