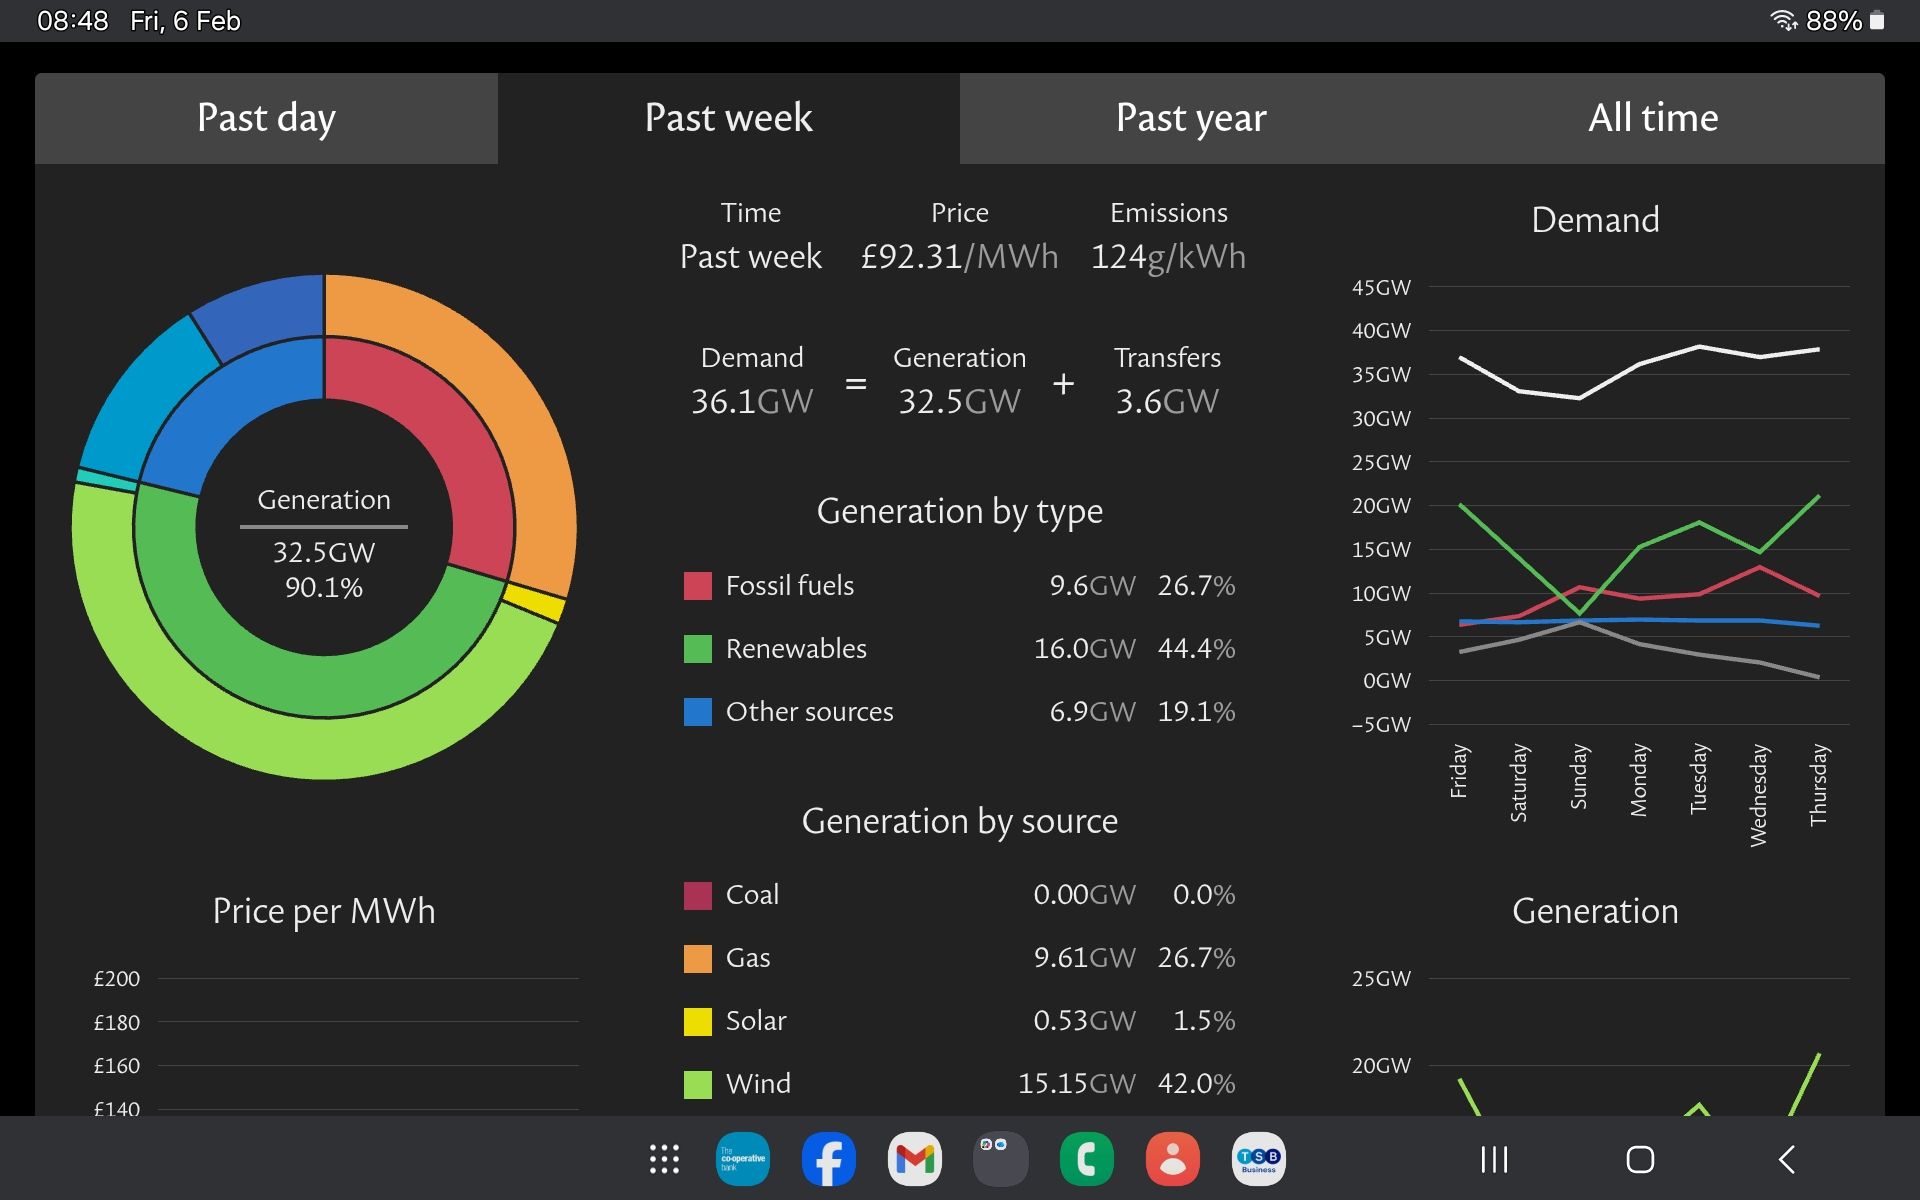
The screenshot does not show a single bad hour or an unusual dip in generation. It shows average UK electricity output over an entire winter week. During that week, the UK’s installed solar capacity of roughly 22 GW delivered an average output of around 0.5 GW — just 2–3 per cent of nameplate capacity.[1] This figure already reflects the realities of winter: short days, low sun angles, cloud cover, and zero output at night.
In mid-winter, the UK typically has around seven hours of usable daylight per day, falling lower in December and January once weather and solar elevation are taken into account.[2] Solar generation therefore occurs for roughly 45 hours per week, not continuously.
What Solar Actually Delivered That Week
Using the observed average output:0.5 GW × ~45 daylight hours = ~22.5 GWh per week
That represents the entire weekly energy contribution of UK solar under normal winter conditions.For context, UK electricity demand in winter typically totals around 6,000–6,500 GWh per week.[3] Solar therefore supplied well under half of one per cent of total weekly demand during that period — despite the scale of installed capacity and land already committed.
Scaling This Reality to the 2030 Plan
Under the DESNZ / NESO Clean Power 2030 pathway, installed solar capacity is expected to rise to around 45 GW, more than double today’s level.[4]
If solar performs in winter 2030 as it did during the week shown — which is consistent with historic UK data — average winter output would rise to around 1.0–1.4 GW, still limited to daylight hours only.
That would deliver approximately:45–63 GWh per week.Against winter demand of more than 6,000 GWh, this equates to around 0.7–1 per cent of weekly electricity consumption — after doubling capacity, land take, grid connections, and cost.
The Land and System Cost Behind the Numbers
Utility-scale solar in the UK typically requires around 2–2.5 hectares per megawatt once panel spacing, access tracks, substations, drainage, and mitigation land are included.[5] Scaling to 45 GW implies tens of thousands of hectares permanently removed from productive use to deliver negligible winter energy.
At the same time, solar contributes no system inertia, no frequency control, and no firm capacity. The NESO has repeatedly warned that increasing reliance on inverter-based, non-synchronous generation increases risks to grid stability and raises the likelihood of system stress events during cold, low-renewables conditions.[6]Solar therefore does not replace gas. It increases dependence on it.
What the Screenshot Really Shows
This was not a failure of weather. It was a demonstration of structural mismatch. Solar performs worst when the UK needs electricity most — during winter weeks, in the evenings, and during cold spells.Doubling or even tripling solar capacity does not solve that problem. It simply spreads it across more land, more infrastructure, and more cost, while leaving the country reliant on gas, imports, and emergency measures to keep the lights on.Solar adds capacity on paper.Gas keeps the system alive.
References
- NESO real-time generation data and weekly winter averages (National Electricity System Operator dashboards).
- Met Office, UK daylight hours and seasonal solar elevation data.
- NESO Winter Outlooks and historic electricity demand statistics (2023–2025).
- DESNZ, Clean Power 2030 pathway and supporting system analysis.
- UK planning application data; Solar Trade Association guidance on utility-scale land use.
- NESO, Operability Framework, Stability Pathfinder, and system risk assessments (2024–2025).

Leave a comment